Monday, April 23, 2012
If I wanted America to fail.
This is one of the best political issue videos I have seen in a very long time. It challenges so much of the conventional wisdom. This upcoming election will be great if it becomes about big ideas and about a real choice between two antithetical ideologies. Democracy is an amazing thing because it allows us to resolve great matters peaceably. More videos like this that frame the discussion about a real choice. I think any reader of this blog knows what side I am on.
Enjoy!
Monday, January 23, 2012
NOK - A fool proof trade?

Hi readers - This is a post I must admit to having written at least a half dozen times over the past 12 months. I have never had the time to do it right, which is why it has not been finished until now. I hope you find some value in it. Full disclosure: I own a position in Nokia and plan to own a position in Nokia for some time.
In a volatile market it is hard to know where to put your money. It is especially hard to be certain when to make a big play on a particular stock or two. For the past several months I have been chastising myself for being far too conservative when I came across stocks that struck me as no brainers. Such examples being, BofA right after the crash when it became clear the Feds would never let it go bust and BP after the gulf spill when the market reaction was way over blown and the stock way over sold. Both of those stocks turned out to be great buys however I did not invest enough to really take advantage of the opportunity.
Nokia struck me as another such no-brainer opportunity. I have been watching the stock for several years and have owned the shares several times over the last 7 years each time making a healthy return. Nokia is currently going through a painful restructuring and as such the stock has been badly beaten up. At the current price, I believe there are few stock opportunities out there that are as attractive. Let me explain why.
1st: Distribution and Manufacturing
Nokia is a world leader in feature phones (still the dominate phone globally sold today)with a world class global distribution network and a very strong presence in the fast growing emerging markets including a dominate position in China (19.1%) (next closest is Samsung with 8%) and India (37%) Nokia is a manufacturer with global economies of scale and can produce phones at a price only Samsung can match. Nokia's feature phones carry a 10% profit margin and are regularly priced 40-50% under their closest competitor. Nokia phones have over the years developed a very strong global reputation for build quality and durability, critical purchasing criteria if, like much of the fast growing developing world, a person can only afford one mobile phone every few years. Nokia is the safe, reliable and trustworthy choice.
2nd: Experience and Brand
Nokia has been a world leader in mobile communication technology for over 20 years. Nokia defined the feature phone category and was a consistent innovator in both features (remember snake) and design (remember the Nokia 9200). Let's not forget that before IOS and Android it was Symbian that was the OS of preference for app developers and smartphone manufacturers. Symbian still has a huge global footprint despite being all but abandoned by most manufacturers. The point here is that Nokia has deep experience in the mobile market and has created category defining products again and again.
The Nokia brand is still widely considered one of the most recognized and valuable brands in the world. In fact, in 2011 the Nokia brand was valued at $25B alone and was ranked as the 15th most recognized brand in the world. If the brand alone is worth $25B how can the whole company be valued at less than $15B less cash?
3rd: Turnaround and Management
Over the last year Nokia has embarked on a major strategic shift, abandoning Symbian for future smartphone development and embracing a partnership with Microsoft centered around Windows Phone. This is, in my opinion, a brilliant strategic move. While the decision to not go with Android received a tremendous amount of second guessing, I believe it was the right decision. Android is a poor platform. I have been a smartphone user for almost 10 years now, having started with early Windows Mobile devices and recently having several Android devices. Android reminds me of all of the problems with Windows XP. Nothing seems to work easily. Android requires a lot of management to keep it running smoothly, the platform has massive system fragmentation issues and suffers from way too many undifferentiated, boring phones. Furthermore, Microsoft's strategy of demanding royalties from Android phone manufacturers has successfully driven up the cost to manufacture each Android phone by an estimated $10 or more. This is/will dramatically change the underlying economics behind low-end Android device manufacturing. This is great news for Nokia because low end Android phones have significantly eroded Nokia's feature phone margins and global market share.

Windows Phone is different (I won't go into all the ways here, I have provided many links below that go into why Windows Phone is a good OS) it is clean, simply, effective and easy. Sure the app market is not what IOS and Android is but it has the really important apps and is getting better all the time. The growth of the Windows Phone App Marketplace has been tremendous growing to over 60,000 Apps since Oct 2010. Below is a chart that outlines the Apps Marketplace growth.

Furthermore, the involvement with Nokia, which is still has a dominate 28.2% global market share, means that there is ever more incentives for developers to choose Windows Phone as their 3rd development platform. Fundamentally, the decision to move forward with Windows Phone was the best possible decision given the options. Additionally, Nokia received a reported $1 - $1.5B from MS to choose Windows Phone which certainly helps make the decision a lot easier.
Given that the hard decision was made less than 12 months ago the turn around strategy has been executed with stunning efficiency and capability. In less than 12 months Nokia has jettisoned 7,000 employees to Accenture , fully transitioned to Windows Phone for their smartphone platform, released three different smartphones across all price points and launched a global marketing campaign including a $200m campaign in the U.S. with Microsoft and AT&T. The phones Nokia released are great looking and absolutely differentiated from everything else on the market.
Examples below:
Nokia Lumia 800 & 900

Lumia 710

4th: Value and Dividend
As of 1/23/2012 Nokia currently trades at $5.74 per share having just bounced off a multi-year low of $4.40 per share. This share price gives Nokia a valuation of $21.5B. Nokia currently has a $7B net of debt cash position. This means that the whole of the Nokia organization including global manufacturing facilities, distribution network, brand, real estate and IP portfolio is valued at less than $14.5B. To me this makes Nokia an amazing value! Nokia, in my opinion, has been way over sold and is undervalued based upon the to date success of the turn around strategy and company's assets.
Conclusion:
The real reason why I think this is a fool proof trade is this: The shares represent an extremely good value as explained above. This is clearly a bet on the turn around strategy, which, in my opinion, is well thought out and has been even better executed. The company currently offers close to a 10% dividend rate meaning that should you need to ride these shares as the turn around takes place you will be well paid for your risk. Should the turn around not pan out as hoped at this price the stock is well placed for an acquisition with Microsoft being the best and most likely acquirer. Since you are being paid 10% to park your money in Nokia you can afford to wait for any of the likely scenarios. Should the turnaround succeed this is a $20+ stock in a year! All of these things add up to what I consider one of the best trade in the market at the moments. As always, there is risk to any trade and do your own research and invest based upon your own needs but for me this is a truly a no brainer.
More info on Nokia below:

Top reasons why WP7 / NOK will eventually own 34% of the world's market. Educate!
1) People are addicted to the best software, what makes the best software, a component market, one WP7 already has. [Bing: "silverlight components" for your proof of the market within the market] Signs of things to come. More developers know Silverlight than anything else. The development tools are the best, MS is fostering the app world the best, Impressive apps are being built in just weeks. Exercise [YouTube "Silverlight Windows Phone 7" for thousands of examples.]
2) You might not know this, "Windows Phone 7 growing faster than Android and IOS", link taken straight from the word of Android. [http://androidheadlines.com/2010/12/shoc...] another link
[http://www.mobileburn.com/news.jsp?Id=13...]
3) MS has aligned with ARM/Nvidia/QualComm/TI. NOK will benefit from this alignment along with Microsoft. Mobile devices and Windows technology will exist heavily in the near future.
[read http://www.microsoft.com/presspass/press... and then bing search more on this topic]
4) Microsoft's Ecosystem dwarfs all others. Microsoft is literally a small solar system at the center of the galaxy representing the size of their ecosystem. Markets within markets within markets, within markets revolve around Microsoft. The total Marketcap of all companies tied to MS technology is absolutely mind boggling. [review https://partner.microsoft.com/US/3000010... which is a huge site, but just a tiny fraction of the total ecosystem, especially if you consider everyone using Word/Excel/Powerpoint/SqlServer/IIS/etc, etc]
5) MS is putting tons of resource into WP7 as it will be the catalyst to BING's search engine becoming a money-for-nothing scenario. NOK is getting paid to use a system they would have eventually migrated to. NOK will bud into the tablet PC market with a cost advantage. "Microsoft is going to spend $9b in total R&D this year and last year’s Windows Mobile OPEX was $0.9B (R&D, sales and marketing) so I expect this year’s OPEX to be around $1.4B." This was written in March when it was announced MS was spending 1 billion in WP7. Plus NOK deal + ARM deal = money, plus (millions of developers + plus ease of development = massive app growth), plus superior hardware, plus celeb advertising$ = SMASH HIT.
6) The NOK/MSFT venture has been in the works for years. Hardware will result shortly. [http://timesofindia.indiatimes.com/tech/...]
7) Naveq + Bing is a world class force. http://wmpoweruser.com/nokias-navteq-tal...
8) XBoxLive is a huge gaming platform. At any one time a million could be playing. Love Call of Duty! MS has made making games for WP7 and making these games live, very easy. Why play a game on your phone against a stupid ai, that's so ancient, play against other humans, nothing is more fun.http://www.electronista.com/articles/10/...
9) Go use a WP7 phone for a few days. Samsung Focus is nice. It really makes all other OSs look outdated and basic. After using a WP7 phone for a few days, your impression of other phone OSs is ruined. Sure there's a few things missing, but coming soon. I love this video http://www.youtube.com/watch?v=qUO51jMGi... I can delete my spam emails in seconds on my WP7 that took minutes with IOs. My WP7 interfaces with my car to read my text messages, something I never got IOs todo.
Thursday, October 20, 2011
Washington DC Has Highest Median Household Income
How sad this is and what a stunning reversal and an ominous trend for the U.S.A. Washington D.C. now has the highest median household income. This is a city that produces no wealth, no goods and no innovation. The city only exists to make rules and regulations that destroy and confiscate the wealth of others. If ever there was a clearer signal of how off track the U.S. has become I would be surprised.
Washington DC Has Highest Median Household Income, As Wall Street Moved to K Street. OKS?
Political Capital Is Now Richer Than Tech Capital

BLOOMBERG -- "Federal employees whose compensation averages more than $126,000 and the nation’s greatest concentration of lawyers helped Washington edge out San Jose as the wealthiest U.S. metropolitan area, government data show.
The U.S. capital has swapped top spots with Silicon Valley, according to recent Census Bureau figures, with the typical household in the Washington metro area earning $84,523 last year. The national median income for 2010 was $50,046.
The figures demonstrate how the nation’s political and financial classes are prospering as the economy struggles with unemployment above 9 percent and thousands of Americans protest in the streets against income disparity, said Kevin Zeese, director of Prosperity Agenda, a Baltimore-based advocacy group trying to narrow the divide between rich and poor.
“There’s a gap that’s isolating Washington from the reality of the rest of the country,” Zeese said. “They just get more and more out of touch."
In recent years Washington has attracted more lobbyists and firms with an interest in the health-care overhaul and financial regulations signed into law by President Barack Obama, according to local business leaders.
“Wall Street has moved to K Street,” said Barbara Lang, president and chief executive officer of the DC Chamber of Commerce, referring to the Washington street that’s home to prominent lobbying firms. 'Those two industries clearly have grown in our city.'"
MP: Considering that Washington has the highest median income in the country thanks to all of the lawyers and lobbyists, and all of the federal employees earning compensation that averaged $126,369 last year, OWS might have the wrong target. After all, it was government housing policies originating in Washington that contributed more significantly to the housing bubble, mortgage meltdown, financial crisis and economic recession than any greed on Wall Street.
Based on a new Gallup Poll (ht: Economix Blog), the American people understand this, and they are more than twice as likely to blame the federal government in Washington (64%) than financial institutions on Wall Street (30%) for the economic problems facing the U.S. How about: Occupy K Street? Or Occupy 1st Street SE?
Washington DC Has Highest Median Household Income, As Wall Street Moved to K Street. OKS?
Political Capital Is Now Richer Than Tech Capital
BLOOMBERG -- "Federal employees whose compensation averages more than $126,000 and the nation’s greatest concentration of lawyers helped Washington edge out San Jose as the wealthiest U.S. metropolitan area, government data show.
The U.S. capital has swapped top spots with Silicon Valley, according to recent Census Bureau figures, with the typical household in the Washington metro area earning $84,523 last year. The national median income for 2010 was $50,046.
The figures demonstrate how the nation’s political and financial classes are prospering as the economy struggles with unemployment above 9 percent and thousands of Americans protest in the streets against income disparity, said Kevin Zeese, director of Prosperity Agenda, a Baltimore-based advocacy group trying to narrow the divide between rich and poor.
“There’s a gap that’s isolating Washington from the reality of the rest of the country,” Zeese said. “They just get more and more out of touch."
In recent years Washington has attracted more lobbyists and firms with an interest in the health-care overhaul and financial regulations signed into law by President Barack Obama, according to local business leaders.
“Wall Street has moved to K Street,” said Barbara Lang, president and chief executive officer of the DC Chamber of Commerce, referring to the Washington street that’s home to prominent lobbying firms. 'Those two industries clearly have grown in our city.'"
MP: Considering that Washington has the highest median income in the country thanks to all of the lawyers and lobbyists, and all of the federal employees earning compensation that averaged $126,369 last year, OWS might have the wrong target. After all, it was government housing policies originating in Washington that contributed more significantly to the housing bubble, mortgage meltdown, financial crisis and economic recession than any greed on Wall Street.
Based on a new Gallup Poll (ht: Economix Blog), the American people understand this, and they are more than twice as likely to blame the federal government in Washington (64%) than financial institutions on Wall Street (30%) for the economic problems facing the U.S. How about: Occupy K Street? Or Occupy 1st Street SE?
Tuesday, October 18, 2011
Faber, Chanos and others on the coming Chinese economic collapse....The interviews.
What I find most incredible about these videos is how in the minority these guys are. I don't know how it could not be more obvious that there is a massive property bubble in China and that the laws of economics cannot be ignored forever. These videos, especially the last one detailing the vast empty cities China has created coupled with the article I mentioned a few posts back about the coming collapse of the Chinese population makes the policy of inflating a massive property bubble to manufacture growth seem two times a loser. If I were long in minerals, materials and consumer goods manufactures banking on China to drive world consumption growth I would cover or get out. As Jim Chanos says, the timing is the difficult part. What is certain in my opinion is that the day of reckoning will come eventually. It always does.
Jim Chanos:
Marc Faber:
Others:
Program on vast empty cities: 64 Million empty apartments..Wow.
Jim Chanos:
Marc Faber:
Others:
Program on vast empty cities: 64 Million empty apartments..Wow.
China's bubble bursting....
Jim Chanos is one of the few people, along with myself, who has consistently made the argument that China is a massive bubble that will burst and that the bursting of the Chinese bubble will be extremely painful. China's bubble is built on massive government manipulation in the Chinese market. China is not a free market and as such huge distortions have been created to ensure GDP growth regardless of the quality and sustainability of that growth. The purpose of such a suicidal economic plan is to serve the political interest of the PRC establishment.
Chanos: China’s hard-landing has already begun China’s bust will be a thousand times worse than Dubai.
Follow link to original article here.
NEW YORK (MarketWatch) — China is heading into an economic storm, and the much-feared hard-landing of the world’s second-largest economy has already started, warned celebrated hedge-fund manager and China-bear Jim Chanos of Kynikos Associates on Monday.
“The numbers are falling faster than we thought,” said Chanos during an exclusive interview with MarketWatch on the sidelines of the 7th Annual New York Value Investing Congress.
“Real estate sales in September and October, which are peak months, fell 40%-60% on-year,” he said.
Chanos also pointed out that Chinese financial and real-estate stocks are down 30% from their peak, while cement and steel prices are declining.
“People are buying into the idea of perpetual growth,” Chanos said. “But they have to ask, ‘Are you really growing?’”
Chanos stressed that investors should understand that there is no bailout without a cost.
“The only way the Chinese government can continue to bail out everyone is to print more money, which will lead to inflation. But people are depositing money [in banks] at below inflation,” the fund manager said.
Chanos had already suggested back in May that there were clear signs of excess supply in China’s commercial real-estate sector.
About 14% of office space in Beijing and 9% in Shanghai was vacant, according to data he cited at the time.
“Western investors must remember that Chinese consumers are not the next big hope,” he said.
1,000 times worse than Dubai
Chanos has consistently said China’s bust will be a thousand times worse than Dubai.
“It’s very hard to let air out of a property bubble without collateral damage,” he said.
Chanos also expressed concerns about the country’s banking sector.
The Chinese economy is adding $2 trillion of new debt every year, and half of that is problematic from day one, he said.
And since only 50% of the problematic debt is recoverable, about $500 billion, or 10% of gross domestic product, is bad debt, he said.
Last week, China’s sovereign-wealth fund bought about $31.5 million worth of stakes in the nation’s “Big Four” lenders — Agricultural Bank of China Ltd. HK:1288 -7.87% CN:601288 +0.38% , Bank of China Ltd. HK:3988 -4.74% CN:601988 +0.33% BACHY +1.53% , Industrial & Commercial Bank of China Ltd. HK:1398 -6.05% CN:601398 +0.48% IDCBF -2.83% , and China Construction Bank HK:939 -4.39% CN:601939 +0.22% CICHF 0.00% . See report on China’s purchase of banking shares.
The move is a likely indication of which banks the Chinese authorities are worried about, according to Chanos.
In his earlier presentation at Monday’s conference, he cautioned Western investors to remember that politics are a big part of business in China, and that in effect, banks are instruments of state policy.
He also reiterated the message that the house always wins when it comes to foreign investors and China. Remember how they treat Western investors, he said.
“History has not been on our side,” he said.
During the interview, he briefly revisited that particular theme. “Corruption is endemic there. Contracts are meaningless,” Chanos said.
Sue Chang is a MarketWatch reporter in San Francisco.
Monday, October 17, 2011
New Obama 2012 Campaign Ad
I love this. It took me a minute to figure out that it was a parody. For the first minute I just thought it was another example of Obama's incompetence. Great ad and one that needs far more visibility.
This debunks one of the common myths spread by the left that government spending creates jobs and wealth. The other myth this debunks is the myth that by working with the Democratic party in a bi-partisan way the GOP can solve the budget deficit issues. The Dems are 100% committed to ever higher government spending and taxes. The GOP, if they are going to get serious about eliminating the deficits and debt needs to take a page from the Dem's playbook and go all in, should the GOP takes all houses of government in 2012. There can be no moderation. The GOP strategy must be to pursue as deep a root and branch overhaul of the federal government as possible in the time given by voters. The GOP must smash the levers of Democratic power as expressed through federal agencies, bureaucracies, institutions and the tax code.
The federal agencies that must be disbanded include; EPA, Dept. of Education, Dept. of Energy and the NLRB.
The institutions that must be changed through reforms/elimination of government programs include the whole institution of publicly funded higher education. We must put a price on the risk of a particular degree so that we end the proliferation of "studies" degrees and get students again focused on degrees that are both productive to society and good for their future earnings. The best way to do this is to get the government out of the business of funding public education through loans and allow private businesses to place a risk premium on particular degrees based upon past employment/earnings performance.
The tax code must be flattened as to ensure that all citizens have skin in the game and thus pay a price for now "free" government services. A flat tax would also do away with politicians favorite form of rewarding friends and punishing enemies. It would also serve the purpose of getting the government out of the business of providing economy distorting subsidies for preferential behavior. The government has no business deciding what is preferential behavior and certainly no business awarding my income to those it deems appropriate.
The combination of the above approaches would actually solve the budget deficit by dramatically lowering spending and because of the elimination of the tremendous regulatory burdens currently placed on the private sector, growth would explode and revenue would rise allowing the debt to be paid down quickly.
Read original article here.
The Austerity Myth: Federal Spending Up 5% This Year
By JOHN MERLINE, INVESTOR'S BUSINESS DAILY
Posted 08:05 AM ET

When Republicans took control of the House in January, they pledged to make deep cuts in federal spending, and in April they succeeded in passing a bill advertised as cutting $38 billion from fiscal 2011's budget. Then in August, they pushed for a deal to cut an additional $2.4 trillion over the next decade.
Some analysts have blamed these spending cuts for this year's economic slowdown.
But data released by the Treasury Department on Friday show that, so far, there haven't been any spending cuts at all.
Higher Spending, Deficits
In fact, in the first nine months of this year, federal spending was $120 billion higher than in the same period in 2010, the data show. That's an increase of almost 5%. And deficits during this time were $23.5 billion higher.
These spending hikes haven't stopped many analysts from claiming that the country is in an age of budget austerity, one that's hurting economic growth.
A July article in USA Today, for example, claimed that "Already in 2011, softer government spending has sapped growth."
Jared Bernstein, former chief economic adviser to Vice President Biden, wrote over the summer that "government spending cutbacks have been a large drag on growth in recent quarters and have led to sharp losses in state and local employment."
Economist and New York Times columnist Paul Krugman argued in September that "the turn toward austerity (is) a major factor in our growth slowdown."
If government spending is related to growth, as these and others claim, then the economy presumably should be growing faster, not slower, given the current higher rates of federal outlays.
State Spending Higher Too
Nor does the claim that state governments sharply cut spending stand up well to closer scrutiny.
Overall state spending continued to climb right through the recession, when all money from state general funds and other funds, federal grants and state bonds is combined.
Total state outlays in 2010 were almost 10% higher than in 2008, according to the National Association of State Budget Officers' annual State Expenditure Report.
And general fund spending — which makes up about 40% of total state spending — is expected to climb 5.2% in 2011 and 2.6% next year, according to the association's latest survey.
NASBO says that states were able to sustain spending growth through 2010 only because the federal government was pumping more money in via the $830 billion stimulus, and that these funds are now all but exhausted.
As the survey report notes, the tapering off of the stimulus "combined with a slow recovery in state revenue collections, will continue the tight resource environment for states in fiscal 2012."
Meanwhile, the claim that state and local government jobs have been severely cut is, at the very least, open to some debate.
"We know that the biggest problem that we've had in terms of unemployment over the last several months has not been in the private sector," President Obama said at a recent press briefing. "It's actually been layoffs of teachers and cops and firefighters."
Monthly data from the Bureau of Labor Statistics do show that from December 2007 — when the recession officially started — until the end of 2010, state and local governments shed 221,000 jobs. And they've cut another 234,000 jobs so far this year.
But a separate annual survey from the Census Bureau shows that "full-time-equivalent" state and local employment climbed 200,000 between 2007 and 2010 (the latest year for which these census data are available.) The differences come from the methodologies used.
In any case, even using BLS data, the number of state and local government jobs has fallen just 2.3% since December 2007. That compares with a decline of 5.4% for private-sector jobs.
The federal agencies that must be disbanded include; EPA, Dept. of Education, Dept. of Energy and the NLRB.
The institutions that must be changed through reforms/elimination of government programs include the whole institution of publicly funded higher education. We must put a price on the risk of a particular degree so that we end the proliferation of "studies" degrees and get students again focused on degrees that are both productive to society and good for their future earnings. The best way to do this is to get the government out of the business of funding public education through loans and allow private businesses to place a risk premium on particular degrees based upon past employment/earnings performance.
The tax code must be flattened as to ensure that all citizens have skin in the game and thus pay a price for now "free" government services. A flat tax would also do away with politicians favorite form of rewarding friends and punishing enemies. It would also serve the purpose of getting the government out of the business of providing economy distorting subsidies for preferential behavior. The government has no business deciding what is preferential behavior and certainly no business awarding my income to those it deems appropriate.
The combination of the above approaches would actually solve the budget deficit by dramatically lowering spending and because of the elimination of the tremendous regulatory burdens currently placed on the private sector, growth would explode and revenue would rise allowing the debt to be paid down quickly.
Read original article here.
The Austerity Myth: Federal Spending Up 5% This Year
By JOHN MERLINE, INVESTOR'S BUSINESS DAILY
Posted 08:05 AM ET
When Republicans took control of the House in January, they pledged to make deep cuts in federal spending, and in April they succeeded in passing a bill advertised as cutting $38 billion from fiscal 2011's budget. Then in August, they pushed for a deal to cut an additional $2.4 trillion over the next decade.
Some analysts have blamed these spending cuts for this year's economic slowdown.
But data released by the Treasury Department on Friday show that, so far, there haven't been any spending cuts at all.
Higher Spending, Deficits
In fact, in the first nine months of this year, federal spending was $120 billion higher than in the same period in 2010, the data show. That's an increase of almost 5%. And deficits during this time were $23.5 billion higher.
These spending hikes haven't stopped many analysts from claiming that the country is in an age of budget austerity, one that's hurting economic growth.
A July article in USA Today, for example, claimed that "Already in 2011, softer government spending has sapped growth."
Jared Bernstein, former chief economic adviser to Vice President Biden, wrote over the summer that "government spending cutbacks have been a large drag on growth in recent quarters and have led to sharp losses in state and local employment."
Economist and New York Times columnist Paul Krugman argued in September that "the turn toward austerity (is) a major factor in our growth slowdown."
If government spending is related to growth, as these and others claim, then the economy presumably should be growing faster, not slower, given the current higher rates of federal outlays.
State Spending Higher Too
Nor does the claim that state governments sharply cut spending stand up well to closer scrutiny.
Overall state spending continued to climb right through the recession, when all money from state general funds and other funds, federal grants and state bonds is combined.
Total state outlays in 2010 were almost 10% higher than in 2008, according to the National Association of State Budget Officers' annual State Expenditure Report.
And general fund spending — which makes up about 40% of total state spending — is expected to climb 5.2% in 2011 and 2.6% next year, according to the association's latest survey.
NASBO says that states were able to sustain spending growth through 2010 only because the federal government was pumping more money in via the $830 billion stimulus, and that these funds are now all but exhausted.
As the survey report notes, the tapering off of the stimulus "combined with a slow recovery in state revenue collections, will continue the tight resource environment for states in fiscal 2012."
Meanwhile, the claim that state and local government jobs have been severely cut is, at the very least, open to some debate.
"We know that the biggest problem that we've had in terms of unemployment over the last several months has not been in the private sector," President Obama said at a recent press briefing. "It's actually been layoffs of teachers and cops and firefighters."
Monthly data from the Bureau of Labor Statistics do show that from December 2007 — when the recession officially started — until the end of 2010, state and local governments shed 221,000 jobs. And they've cut another 234,000 jobs so far this year.
But a separate annual survey from the Census Bureau shows that "full-time-equivalent" state and local employment climbed 200,000 between 2007 and 2010 (the latest year for which these census data are available.) The differences come from the methodologies used.
In any case, even using BLS data, the number of state and local government jobs has fallen just 2.3% since December 2007. That compares with a decline of 5.4% for private-sector jobs.
Thursday, October 13, 2011
#OccupyOliveGarden
This started here. This is a parody on the Occupywallstreet protests that I saw a gentleman post on a blog. I have added the graphics and #freesoupsalad&breadsticks4all. Great humor and fantastic political satire.
While I strongly disagree with much of what the Occupywallstreet protesters advocate, I can appreciate their desire to excise their constitutional rights of freedom of expression. I only wish that the protesters acknowledged the value of the freedoms they enjoy and the many sacrifices made to protect them. The U.S. constitution is truly an amazing document and apart from what Erza Klein may think it is not confusing and was written by people who were endowed with equal intelligence to present day man and clearly much more courage. Rather than argue for greater government intervention in their lives the protesters should join those of us who have come to the realization that politics ruins most things it touches and as such the less it touches the better. A limited government is the best path to individual prosperity. This has been proven as there is not one example in history of a government having made all of their citizens rich nor succeeded in eliminating want. Want and greed are human emotions and let us pray that the day never comes when government has grown so large, in the U.S., that it has the power to stamp out emotion in the name of destroying greed and want.
This is why I call on all citizens of this great nation and of those freedom loving citizens of great nations and proud peoples around the world to #OccupyOliveGarden!

Tuesday, October 11, 2011
Six Adults and One Child in China
Excellent analysis. The picture is becoming increasingly clear that a demographic weapon of mass destruction that will explore in the next 20 years with devastating consequences for those that will come of age when it occurs. I cannot see how my generation will meet these challenges while providing for our kids and our own retirement. The economic and political implications of this coming "gray tsunami" are enormous and poorly understood/planned for. I fear that if substantive change is not immediately implemented with regard to reforming entitlements in the U.S. there will be very few other options than to default on "promises" made to the older generation.
As for the rest of the world, this data shows me that much of the world will likely become wealthier as the pie is distributed among fewer individuals, however, overall growth will likely slow unless there is asset inflation or individual consumption reaches levels not thought possible. This also leads me to believe that we will hear endless stories in the affluent work press about the have nots in the high birthrate countries where due to the pie being sliced ever thinner will likely see average consumption and quality of life fall. This is due mainly to the fact that there is very little capital base in these countries already and thus fewer fixed productive assets with which to generate prosperity. This combination of factors coupled with the growing affluence in low birth rate countries will lead to endless tales of unfairness and inequality in the global trading system. This will likely result in continued resentment and possibly armed conflict/terrorism. This will also likely lead to some form of mineral embargo by mineral exporting, high birthrate countries. This type of embargo would be wise and will likely achieve it's stated aim of spreading affluence more broadly, that is of course, if these countries are governed properly and the wealth is used to increase the overall good rather than stolen to enrich a connected few, which sadly, is likely to be the case.
All said, things will be roughly the same as they are today apart from the principle actors on the global stage potentially being rearranged.
SIX ADULTS AND ONE CHILD IN CHINA
by Emma Chen and Wendell Cox 10/10/2011

On a Saturday afternoon at The Bund, Xiao Ming (or “Little Ming”) clings tightly onto the hands of his paternal grandparents. His maternal grandparents walk slightly ahead, clearing a path for him in the midst of all the buzz and traffic. Retracing the imprints of their imaginary footsteps, Xiao Ming takes his first tentative steps as a three year old in town for the first time. Slightly behind him, the watchful eyes and ready hands of his own parents spur him on. 1
Xiao Ming’s personal parade epitomises the popular quip in Shanghai and across China, that “it takes six adults to raise one child”. These six individuals form the unspoken support structure of China’s youth: While the OECD points out that 80% of students in Shanghai attend after-school tutoring, it fails to capture the “soft factors” behind Shanghai’s top rankings in the Program for International Student Assessment (PISA). Popular Chinese dramas such as <<房奴>> (House Slave) depict this in meticulous detail: Grandparents spend hours brewing “brain tonics” for their grandchildren, and parents pack austere work lunchboxes to save up for their child’s tuition fees.
LOW FERTILITY AND THE DEMOGRAPHIC DIVIDEND
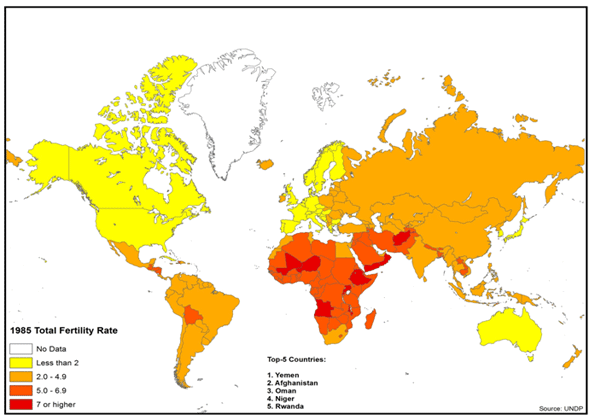
Fifty-five years ago, China’s fertility rate was 6.1. This had fallen to 1.8 in 2010. This means that in 1955, the typical female in China would have had, on average, six children during her productive life cycle; in 2010 she would have had less than two. If Xiao Ming were born in the 1950s, he would probably have had to vie for attention and resources with at least five other siblings. Today, he has the devoted attention and care of two generations before him. Overall, the number of Chinese under 14 has declined by 6.3 percent over the last decade. (Pierson and David, 2011).
And to be sure there are short and medium term advantages to this situation. These anecdotal observations point to demographic trends that ultimately contribute to the optimal development of a nation’s trajectory. Children may be a blessing, but in many cases too many of them overburden the working population. Indeed some describe this combination of low-fertility with a large workforce as the “demographic dividend” (RAND, 2002).
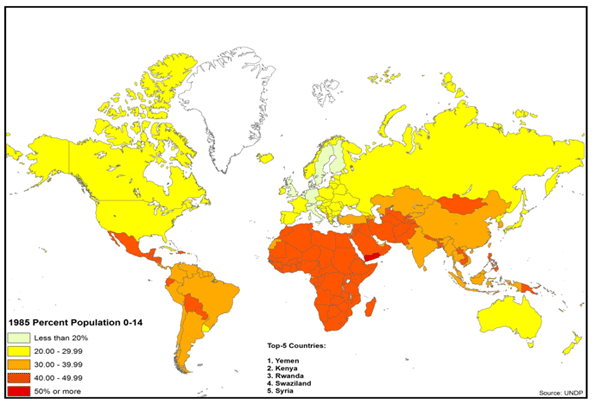
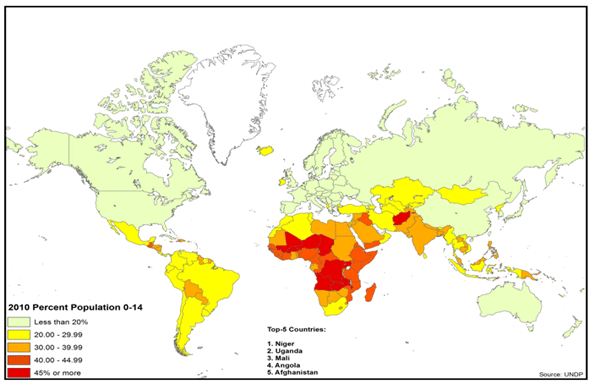
It is of little surprise that countries with a high Youth Dependency Ratios (children under 15 per 100 persons of working age, or 15 to 64) are less stable, and turn up as hotspots on the world map (Figures 1 & 2). Liberia for instance has a 5.1 percent annual natural population increase rate, 81 children per 100 of working age, and a fertility rate of 4.7. In contrast, prosperous Denmark has a 0.3 percent annual natural population increase rate, 28 children per 100 of working age and a fertility rate of 1.9 (UNDP, 2010).
As population increases outpace economic opportunities and growth, nations at risk fail to accommodate new entrants into the workforce. In addition, caring for children requires a high proportion of resources, thus depressing the rate of economic growth. (Bloom et.al., 2001).
A low median age is thus a harbinger of impending stresses, where in extreme cases at least 50% of the population is below 20 years of age (UNDP, 2010). In comparison, the median age of the developed world averages 30 – 40 years. This forms the foundational basis of several youth bulge studies of late, explaining demographic factors behind the Arab Spring (Anderson, 2011), that was in part driven by massive increase in youth (Hvistendahl, 2011; Fuller, 2003) and the youth workforce (Kuhn and Korbel, 2011; Schwartz, 2011), much of whom are unemployed and underemployed (Bajora, 2011).
THE FERTILITY IMPLOSION
Yet there is a distinct disadvantage as well to ever lower birthrates. Globally population growth rates are likely to continue dropping – to less than 0.8 percent worldwide by 2025 – largely due to an unanticipated drop in birthrates in developing countries such as Mexico and Iran. These declines are in part the result of increased urbanization, the education of women, and higher property prices. Already the global fertility rate, including the developing countries, has dropped in half to an estimated 2.5 today (Longman, 2010a). Close to half the world’s population lives, notes demographer Nicholas Eberstadt, in countries with below replacement rate birth-rates. The world, he suggests, is experiencing a “fertility implosion” (Eberstadt, 2010).
Like a population explosion, a demographic implosion has consequences. Countries that have previously engineered reductions in the fertility rates – Singapore (Yap, 2003), Hong Kong (FPAHK, 2011), Vietnam (Bennett-Jones, 2000), India (WHO, 2011) and Indonesia (Hull, 2007) – have done so to achieve more manageable economic conditions. Similar initiatives are being debated, even in the in the Philippines (Pernia et. al., 2011), where religious interpretations are being contested. China’s “one child policy” represented just a more authoritarian expression of a widespread global process. Yet this process often includes many unintended and potentially damaging consequences. However, elsewhere, virtually the same results were replicated without government policy direction, such as in Brazil (Gomey, 2011).
Chinese “fertility implosion” is already having profound impact on marriage in China. Today researchers characterize declining fertility in China into “waves of singletons” (单身潮). While the first three, distinct “waves” or phases since 1950 are well established (王霞, 2006),it has recently been noted that the fourth (第四次单身潮) is currently in progress(陈亚亚, 2011). In the fourth and current wave, women increasingly view child-bearing and marriage as a form of entrapment and a burden that can interfere with aspirations of affluence (杨燕明 2011; 黄蓉芳 and 杨励潮, 2011).
Not surprisingly this is most evident in the advanced urbanized parts of China, such as Shanghai, where there are already three million people over 60, or 2l percent of the population, roughly equal to the share in many advanced countries (McCartney, 2009).
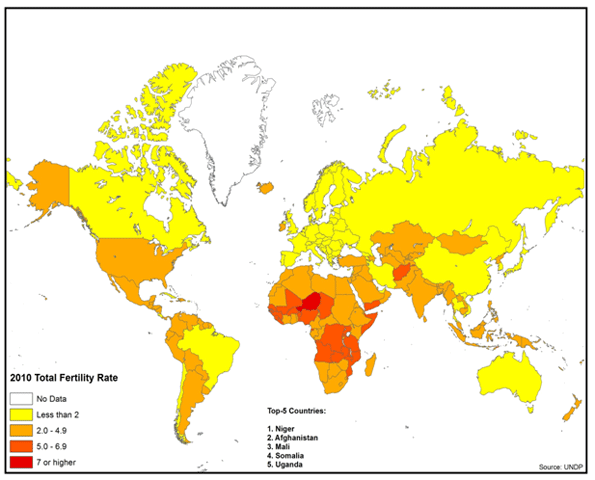
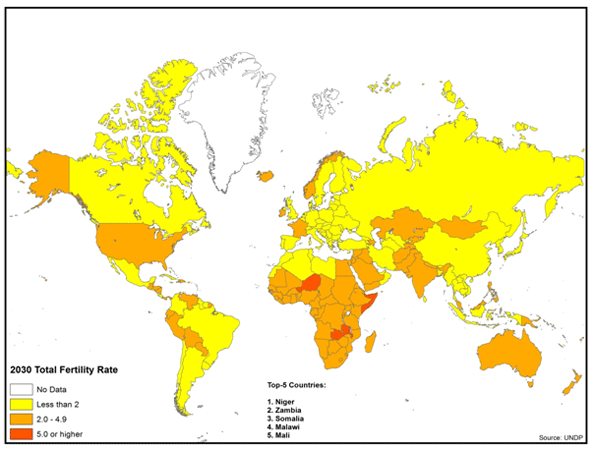
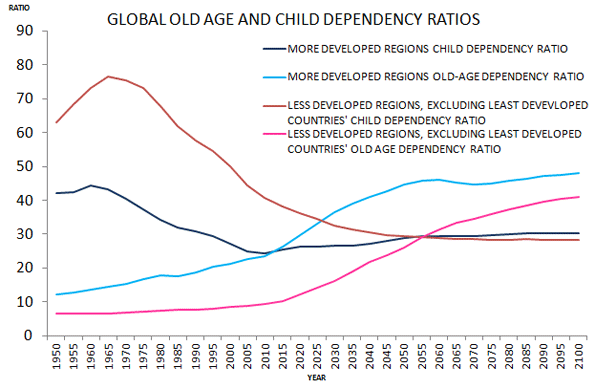
China now has a fertility rate of 1.6, below that of Western Europe. Nor is China alone. Other middle income nations and even low income nations are experiencing significant declines in fertility rates. Brazil and Iran already have fertility rates less than that of the United States. In Bangladesh and Indonesia, fertility rates are projected to drop below replacement rates (2.1) by 2030. Around the world, increasing affluence has been associated with fewer children, as is indicated in Figures 1 – 3. The longer run implications of these less than replacement fertility rates (2.1) is smaller and much older populations (Figures 3, 4 &5).
GRAYING OF THE WORLD
Here’s the big issue down the historical road: Thirty years from now, how will Xiao Ming handle six elderly parents and grandparents, all by himself? Xiao Ming’s impending dilemma is not unique to China.
Overall what author Phil Longman calls a “gray tsunami” will be sweeping the planet, with more than half of all of population growth coming from people over 60 while only six percent will be from people under 30. The battle of the future – including in the developing world – will be, in large part, how to maintain large enough workforces required for the economic growth needed to, among other things, take care of and feed the elderly (Longman, 2011b). The National Bureau of Research (NBER) further notes that similar to child dependents, a large elderly population similarly requires a large proportion of resources, which likewise can inhibit economic growth (Bloom et. al., 2001).
Right now the situation seems dire. Fertility rates are projected to continue their decline. Increasing life expectancy is contributing to a substantial increase in the elderly population. In many nations, the size of the elderly population will exceed that of the under 15 population for the first time.
This could not have happened at a worse time, because the elderly have become ever more dependent on the state in many nations. Supporting a larger elderly population requires a larger work force, however it will be smaller.
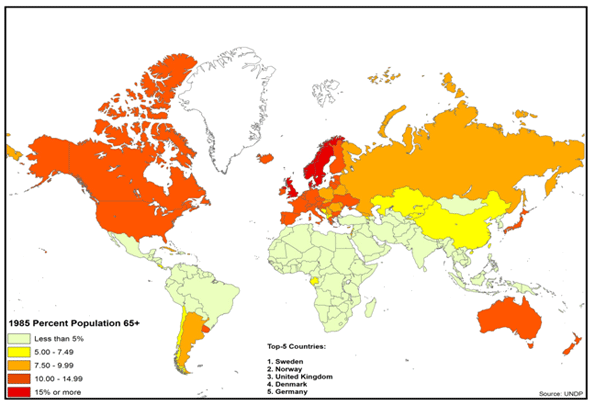
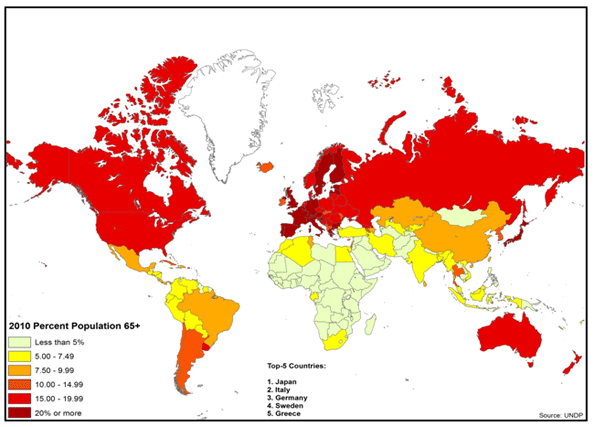
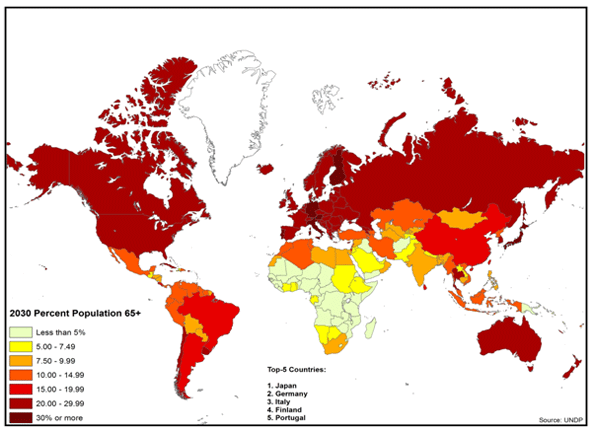
All of this leads to a demographic future that promises to challenge the nations of the world as never before. This is illustrated by rising Old Age Dependency Ratios in Figures 6, 7 & 8.
High income countries are projected to experience elderly population increases on the order of 60 percent in relation to the working age population (15 – 64) by 2030. In the United States, there are now 20 people 65 or over for every 100 of working age; little changed since 1985, when it was 18. However, by 2030 there will be 33 seniors per 100 working people. More extreme will be the fates of the world’s third and fourth largest economies. Germany’s ratio of elderly to working age individuals is already 33, compared to 21 in 1985. In 2030 this ratio will rise to an almost unimaginable 48, meaning that there will be only two working people per retiree. Japan’s situation is even worse. As recently as 1985, Japan had a relatively healthy 15 retirees for every working age person. Today this ratio is one the world’s most extreme: with 35 seniors per 100 working age people. In 2030, this ratio is expected to rise to 53.
Things will be a bit better, at least in the next two decades, in middle income countries such as China and Brazil. But the rate of aging will be even greater than in the high income nations. Both China and Brazil will experience a doubling of their Old Age Dependency Ratios; both will rise slightly above current US levels by 2030. China is projected to rise from 11 to 23, while Brazil’s will increase from 10 to 20. Despite its theological regime, which might be seen as working against smaller families, middle-income Iran is also aging rapidly. It should see a doubling of its Old Age Dependency Ratio, but from a low 7 to a manageable 14.
There will be a mix of results in the lower income countries, as illustrated by the Philippines and Nigeria. In the Philippines, the fertility rate is expected to remain high by current global standards, at 2.6 in 2030, only a modest drop from the present 2.9. However, the elderly will increase 60 percent relative to the working age population (from an Old Age Dependency Ratio of 6 to 10 in 2030). Similarly, in Nigeria the fertility rate is expected to decline only slightly, from 4.8 to 4.5. Alone among the group of nations reviewed, Nigeria is expected to experience only a negligible increase in the Old Age Dependency Ratio, remaining at 6. In 1985, these nations had Old Age Dependency Ratios of between 5 to 7 (UNDP, 2010).
Even if we were to discount population projections going forward (Shahani, 2011), the world is on the verge of a global demographic precipice (Figure 9) – one in which the the increase in proportion of elderly far outweighs that of the increase in proportion of children. A world which Andrew Blechman terms, “a world without children” (Blechman, 2009), and that Ted Fishman describes as one which “pits young against old, child against parent, worker against boss, company against rival, and nation against nation” (Fishman, 2009).
FINANCING THE UNFINANCABLE?
Where there is Virtually Universal State Support.The options available for addressing increasing old age dependency are not very attractive. Older people require considerably more in terms of overall support, particularly for health care, than younger generations (Feinberg et. al., 2011). This is a crisis particularly in demographically declining countries with well-developed social welfare nets. A recent Bank of International Settlements study found that, due to these pressures, Germany’s ratio of public debt to gross domestic product could exceed 200 percent in 2030, with annual debt service approach 10% of GDP. This would be a fiscal burden twice that of Greece today (Eberstadt and Hans, 2010).
Where there is Less State Support: In many nations, state retirement systems often fail to cover a large share of the elderly population. While arrangements vary widely, many elderly must find their own ways to survive, such as by working longer or by relying on families. As emerging nations consider establishing or expanding social safety nets for the elderly, they need to consider the experience of the high-income world welfare states.
Family Support: Given the stresses on public systems, it might be hoped that the elderly could be supported by their children. But this solution has been losing hold throughout the developed world. The mathematics cannot work in any of the challenged nations, at whatever income level: As the elderly population increases relative to the working population, an adult Xiao Ming is unlikely to be able, or willing, to support six parents or grandparents or even two or three.
Reduce Benefits? The accounting answer may be simple – limit elderly benefits to what society can afford. But the politics do not work. Concentrated, organized interests, such as the elderly who receive state benefits, are likely to block any such reforms. The difficulty of dealing with today's challenges, which are modest compared to the future, is illustrated by recent developments in Western Europe and the United States, where recipients of state aid have fought, often successfully, to retain their benefits even in the face of significant funding challenges.
Increase the Birth Rate? A substantial increase in the birth rate in low fertility nations could help, but it would need to happen immediately. This would require broad acceptance of earlier and more frequent child-bearing women, many of whom are increasingly finding a life of affluence to be preferable to one of child-raising. Some projections show increases in the fertility rate in future years, however it could be too little-too late (UNDP HDI, 2010).
More Migration? Increased migration from poorer countries could help richer countries finance the needs of their elderly. However, migration rates are dropping even in the United States, which is by far the world’s largest country for immigration. Although the US foreign born population grew by 10 million over the past decade, both illegal and legal immigration have been dropping. In 2008 there were over one million naturalizations; last year there were barely 600,000, a remarkable 40% drop (Ohlemacher, 2006).
Working Longer: As life expectancy has increased in recent decades, retirement ages have changed little. For example, in the United States, since the establishment of the state retirement system, life expectancy at birth has increased 16 years, while the retirement age has increased only two years. Generally, every additional year in life expectancy is an additional year of state support. One possible solution would be to extend retirement ages beyond the 65 years common in the high income world. Yet while life expectancy has increased, perhaps in 2030, the standard Old Age Development Ratio should be calculated using the population that is more than 75 years old instead of 65.
More Women in the Work Force: Another factor that could assist in meeting the daunting financial challenge of supporting the elderly would be for an increase in female participation in the workplace. The extent to which such an expansion is theoretically possible varies significantly by nation, but this could be part of the solution. There is an important caveat, however. Increasing the supply of workers does not automatically create wealth. Western Europe has had intractable unemployment rates for decades and has been joined in recent years by the United States. More workers, of either sex, will require strong enough economic growth to generate sufficiently high paid employment.
Affordable Housing:One reason for lower birthrates may be the cost of housing. Many of the countries, and regions, with the most expensive housing also tend to experience the lowest fertility – Taiwan, Singapore, Hong Kong, and much of Western Europe. Across China, for example, it is generally agreed that apartment sales prices are exceedingly high relative to incomes (Pierson, 2011). In a number of places with considerable land for new development, like the United Kingdom, Australia and some metropolitan areas of the United States and Canada, researchers have connected substantially increasing prices and housing shortages with overly-restrictive land use regulation. Any strategy that would encourage greater fertility might need to address this issue. Further, the artificially higher house prices consume discretionary income that could be better put to encouraging economic growth by increasing the demand for other goods and services.
Economic Growth: Economic growth represents the best hope. Chinese-level GDP increases would better position to countries for demographic challenges than the Japanese or European rates of the last two decades. Clearly, economic expansion would ameliorate the pre-occupation with splitting the economic pie. It will also be important to pursue policies that minimize costs for households. If, for example, the cost of housing or food is less, more money will be available for necessary social programs (and there will be less resistance to funding them). In a sense, the difference between laggard and strong economic growth can make a huge difference. For example, economist Bret Swanson has shown that the United States could conquer its well-publicized debt burden with economic growth rates of 4 percent (Swanson, 2011).
This Issue Must be Addressed: No one can accurately predict the future, but it is necessary to focus on the issue of aging and declining fertility. In advanced countries, if the elderly retain their state benefits and economic growth continues to be modest or even stagnant, the pressure on economies will be severe. There will be, to put it simply, less money to go around. Those who primarily fund the state – the working population – will have to pay more and could see material reductions to their standards of living. Central Bankers could yield to the temptation to print enough money to seemingly hyper-inflate away the problem, but that could lead to a lower standard of living for all.
Overall our research suggests several possible solutions, including extending work and careers into the 70s; means tested benefits; greater incentives for having children; and measures to keep housing, and whenever possible, more affordable and family friendly. But the ultimate issue will be maintaining economic growth.
The future of Xiao Ming and billions more will depend upon the result.
Emma Chen is a Senior Strategist at the Centre for Strategic Futures, Singapore. The views expressed within this article are solely her own. Publication does not constitute an endorsement by the Centre for Strategic Futures, Singapore.
Wendell Cox is a consultant specializing in demographics and urban issues, principal of Demographia and a visiting professor at the Conservatoire National des Arts et Metiers in Paris.
This project was supported by the Legatum Institute. Maps designed by Ali Modarres, chairman, Geography Department, California State University, Los Angeles.
REFERENCES
王霞. 2006. “第三次单身潮解析 (Analysis of Youth Single Phenomenon in the Third Bachelor Trend).”中国青年研究(China Youth Study) 2006(12).
杨燕明. 2011. “大家谈中国:第四次单身潮反映家庭婚姻危机 (Everybody Discusses China: Fourth Wave of Singles Reflects Family and Marriage Crises).” BBC News. Accessed September 19, 2011.
http://www.bbc.co.uk/zhongwen/simp/comments_on_china/2011/07/110720_coc_....
陈亚亚. 2011. “都市单身女性的生存状态考察 (Observations on the living status of urban single females).” 华人社会和谐家庭论坛暨第九届全国家庭问题学术研讨会(The Ninth National Conference on Family Issues, The Forum for Chinese Societal Harmony and Family), hosted in Guang Dong, 2011.
黄蓉芳 and 杨励潮. 2011. “中国将迎第四次单身潮 近4%的女性因性取向单身 (China Will Meet its Fourth Wave of Singles - Nearly Four Percent of Females are Single Due to Sexual Orientation).”Xinhua, July 19.
Anderson, Lisa. 2011. “Demystifying the Arab Spring.” Foreign Affairs May/June 2011 2-7.
Bajoria, Jayshree. 2011. “Demographics of Arab Protests.” Council on Foreign Relations. Accessed September 19, 2011. http://www.cfr.org/egypt/demographics-arab-protests/p24096.
Bennett-Jones, Owen. 2000. “Vietnam’s Two-Child Policy.” BBC News. Accessed September 19, 2011. http://news.bbc.co.uk/2/hi/asia-pacific/1011799.stm.
Blechman, Andrew D. 2009. Leisureville: Adventures in a World Without Children. New York: Grove Press.
Bloom, David E., David Canning, and Jaypee Sevilla. 2001. “Economic Growth and the Demographic Transition.” NBER Working Paper Series. Accessed September 19, 2011.http://www.nber.org/papers/w8685.pdf.
Eberstadt, Nicholas, and Hans Groth. 2010, “Time for Demographic Stress Test.” Wall Street Journal, November 27.
Eberstadt, Nicholas. 2010. “The Demographic Future.” Foreign Affairs 89:54-64.
Feinberg, Lynn, Susan C. Reinhard, Ari Houser, and Rita Choula. 2011. “Valuing the Invaluable: 2011 Update – The Growing Contributions and Costs of Family Caregiving.” AARP Public Policy Institute. Accessed September 9, 2011. http://assets.aarp.org/rgcenter/ppi/ltc/i51-caregiving.pdf.
Fishman, Ted. 2010. Shock of Gray. New York: Scribner
Friedman, Benjamin. 2005. The Moral Consequences of Economic Growth. New York: Alfred A. Knopf.
Fuller, Graham E. 2003. “The Youth Factor: The New Demographics of the Middle East and the Implications for U.S. Policy”. Brookings Institute. Accessed September 19, 2011.
http://www.brookings.edu/~/media/Files/rc/papers/2003/06middleeast_fulle....
Gorney, Cynthia. 2011. “Brazil’s Girl Power.” National Geographic, September.
Hvistendahl, M. 2011. “Young and Restless can be a Volatile Mix.” Science 333:552-4.
Hull, Terence H, “Formative Years of Family Planning in Indonesia,” in The Global Family Planning Revolution: Three Decades of Population Policies, edited by Warren C. Robinson and John C. Warren (Washington: The World Bank, 2007), 246.
Kuhn, Randall, and Josef Korbel. 2011. “On the Role of Human Capability in the Arab Spring.” Working paper, University of Colorado Boulder. Accessed September 19, 2011.http://www.colorado.edu/ibs/pubs/pop/pop2011-0011.pdf.
Longman, Phillip. 2010. “Think Again: Global Aging.” Foreign Policy. Accessed September 19, 2011. http://www.foreignpolicy.com/articles/2010/10/11/think_again_global_agin....
Longman, Phillip. 2011. “The World Will be More Crowded – With Old People.” Foreign Policy. Accessed September 19, 2011.http://www.foreignpolicy.com/articles/2011/08/15/the_world_will_be_more_....
McCartney, Jean. 2009. “China Steps Back from One Child Policy.” Times, July 24.
Ohlemacher, Stephen. 2006. “3M a Year Leave Developing Countries.” Associated Press, August 17.
Pernia, Ernesto M., Stella Alabastro-Quimbo, Maria Joy V. Abrenica, Ruperto P. Alonzo, Agustin L. Arcenas, Arsenio M. Balisacan, Dante B. Canlas, Joseph J. Capuno, Ramon L. Clarete, Rolando A. Danao, Emmanuel S. de
Dios, Aleli dela Paz-Kraft, Benjamin E. Diokno, Emmanuel F. Esguerra, Raul V. Fabella, Maria Socorro Gochoco-Bautista, Teresa J. Ho, Dennis Claire S. Mapa, Felipe M. Medalla, Maria Nimfa F. Mendoza, Solita C. Monsod, Toby Melissa C. Monsod, Fidelina Natividad-Carlos, Cayetano W. Paderanga, Gerardo P. Sicat, Orville C. Solon, and Edita A. Tan. 2011. Discussion paper, University of the Philippines. Accessed September 19, 2011.http://www.econ.upd.edu.ph/dp/index.php/dp/article/viewFile/670/132.
Pierson, David. 2011. “In China, Having Children is no Longer a Given.” Los Angeles Times, September 2.
RAND Corporation. 2002. “Banking the ‘Demographic Dividend’.” Accessed September 19, 2011.http://www.rand.org/pubs/research_briefs/RB5065/index1.html.
Shahani, Lila Ramos. 2011. “Whither the RH Bill”. BusinessWorld Online. Accessed 19 September, 2011. http://www.bworldonline.com/content.php?section=Opinion&title=Whither-th...
Schwartz, Stephanie. 2011. “Youth and the ‘Arab Spring’.” United States Institute of Peace. Accessed September 19, 2011. http://www.usip.org/publications/youth-and-the-arab-spring.
Swanson, Bret. 2011. “The Growth Imperative.” Presentation to the National Chamber Foundation, Washington D.C., May 24. Accessed September 19, 2011.http://entropyeconomics.com/wp-content/uploads/2011/05/EE-NCF-Growth-Imp....
The Family Planning Association of Hong Kong. 2011. “Family Planning Milestone.” Accessed September 19, 2011. http://www.famplan.org.hk/fpahk/en/template1.asp?style=template1.asp&con....
United Nations Development Programme. 2010. “International Human Development Indicators.” New York: UN Human Development Report Office. Accessed September 19, 2011.http://hdr.undp.org/en/statistics.
U.S. Department of Homeland Security. 2010. “Table 20 - Petitions for Naturalization Filed, Persons Naturalized, and Petitions for Naturalization Denied: Fiscal Years 1907 to 2010.” Washington D.C.: U.S. Department of Homeland Security. Accessed September 19, 2011.http://www.dhs.gov/files/statistics/publications/YrBk10Na.shtm.
United Nations Development Programme. 2010. “International Human Development Indicators.” New York: UN Human Development Report Office. Accessed September 19, 2011.http://hdr.undp.org/en/statistics.
United Nations Development Programme. 2010. “International Human Development Indicators.” New York: UN Human Development Report Office. Accessed September 19, 2011.http://hdr.undp.org/en/statistics.
United Nations Development Programme. 2010. “International Human Development Indicators.” New York: UN Human Development Report Office. Accessed September 19, 2011.http://hdr.undp.org/en/statistics.
World Health Organization Regional Office for South-East Asia. “India and Family Planning: An Overview.” Accessed September 19, 2011.http://www.searo.who.int/LinkFiles/Family_Planning_Fact_Sheets_india.pdf
Yap, Mui Teng. 2003. “Fertility and Population Policy: The Singapore Experience.” Journal of Population and Social Security (Population) 1:643-58.
|
Subscribe to:
Posts (Atom)